When electromagnetic radiations interact with atoms and molecules of matter, then the electrons present in these atoms may absorb energy and move to a higher energy state, losing their stability. To regain their stability, they then move from the higher energy state back to the lower energy state. These atoms and molecules produce radiations in several regions of the electromagnetic spectrum while jumping between different energy levels. This spectrum of radiation which is emitted or produced by electrons in the excited atoms or molecules is termed as the emission spectrum.
In simple words, The emission spectrum of a chemical element or compound is referred to the spectrum of frequencies of electromagnetic radiation produced or emitted by an atom or molecule making a transition from a high energy state to a lower energy state.
Atomic Spectra
• When a ray of white light falls on a prism, it generally experiences refraction twice. Primarily, when the light travels from the rarer medium (example; air) to a denser medium (example; glass) and secondly when the light from the denser medium (example; glass) to a rarer medium (example; air).
• Lastly, a band of colours, called spectrum is observed. On observing this spectrum more thoroughly, it was found that the colour having a smaller wavelength deviates the most.
• Hence, a spectrum of colours ranging from red to violet is seen where the colour red has the longest wavelength and thus suffers the least deviation. This type of spectrum is termed as a continuous spectrum.
• Though, the emission spectrum of atoms present in its gas phase, do not show a continuous spread of the wavelength from one colour to another. Instead, the emitted light contains a specific wavelength having dark spaces between them. Such type of spectra is further known as atomic spectra or line spectra.
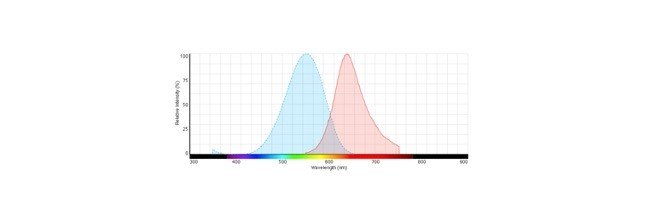
Absorption Spectrum
An absorption spectrum is similar to a photographic negative of the emission spectrum. For detecting the absorption spectrum, electromagnetic radiations are bombarded on a sample that absorbs radiation of certain wavelengths. The wavelength of radiations thus absorbed by the matter will contribute to the missing wavelength by leaving dark spaces in between the bright continuous spectrum. Each element has its exclusive line emission spectrum. Spectroscopy refers to the study of the emission spectrum or absorption spectrum.
Hydrogen Emission Spectrum
• Electrons present in an atom or a molecule absorb energy and then moves from a lower energy level to a higher energy level, on the other hand, electrons emit radiations when they come back to their original states. This phenomenon also accounts for the emission spectrum termed as a hydrogen emission spectrum. The emission spectra of molecules are commonly used in the chemical analysis of elements.
• The hydrogen spectrum is a significant piece of evidence that further shows that the electronic structure of the atom is quantized. When an electric discharge is passed through a gaseous hydrogen molecule, it was found that the hydrogen atoms present in the molecule dissociate thus leading to the emission of electromagnetic radiation by the excited hydrogen atoms. The hydrogen emission spectrum generally comprises of radiations of distinct frequencies.
• When a hydrogen atom absorbs a photon then the energy of the photon causes the electron to undergo a transition to a higher energy level (for instance n = 2 n = 3). On the other hand, when a hydrogen atom produce or emit a photon, the electron thus undergoes a transition from a higher energy level to a lower energy state (for instance; n = 4 n = 3) During this transition that is from a higher energy level to a lower energy level, a transmission of light occurs. As the energy levels of the atom are quantized, the spectrum formed will contain wavelengths that will further reflect the differences in the energy levels.
Hydrogen Emission Spectrum Series
In the year 1885, based on his experimental explanations, Balmer suggested the formula for associating the wavenumber of the spectral lines and the energy shells involved. This formula is as follows:
ν¯ =109677 (1/22 – 1/n2)
Where, ν¯ signifies the wavenumber of electromagnetic radiation. This series of the hydrogen emission spectrum mentioned above is termed as the Balmer series.
It is easy to calculate the spectral lines by using the Rydberg formula;
1/λ = RZ2 [(1/nf2) – (1/ni2)]
Where,
• h signifies Planck’s constant
• c signifies the speed of light
• Z signifies the atomic number
• n1 and n2 are whole numbers representing the energy levels such that n1 < n2.
• The value of the Rydberg constant, RH is equal to 1.0967 x 10⁷ m-1
The Balmer series is the part of the hydrogen emission spectrum which is further accountable for the excitation of an electron from the second energy shell to any other shell. Likewise, other transitions have their series names.
For instance; Paschen series, Lyman series etc. The spectral lines observed are because of the jumping of electrons between different energy levels in the atom.
The spectral series are significant to study because in astronomy it is used for detecting the presence of hydrogen.
Emission Spectrum vs Absorption Spectrum
Emission Spectra
Absorption Spectra
This type of spectrum is produced when atoms release or emit energy
This type of spectrum is produced when atoms absorb energy
Emission spectrum consists of coloured lines
Absorption spectrum consists of dark lines or gaps
It is very helpful in analzing the composition of a certain matter
This can be used often to figure out the capability of objects to retain heat and its absorption level