Category: Study Materials

Category: Study Materials

  • Prophase: Definition, Checkpoints, Diagram, and Examples

    Cell Cycle, Cell Cycle Phases, and Prophase

    Cell cycle is the sequential process taking place to regulate the growth of organism; cell divides to produce a genetic replica and enters the stage of cell growth.

    Cell growth involves the synthesis of organic material and integrates information across its counter parts for synchronous development of the whole body.

    The cell synthesis phase lasts till a cell reaches its maturity; on initiation the cell again divides to produce new cell and the process continues. Cell cycle is a sequential development of cell between two cell divisions.

    The cycle is genetically controlled and are programmed in every cell and are specific for each region.

    Varied species has variable time length of cell cycle decided by physiological and influences pertaining to their niche.

    Two Phases of cell cycle are: INTERPHASE and MITOTIC PHASE. INTERPHASE involves G1, synthesis and G2 phase; chromosomal replication and development is regulated by the phase; determines the quality and quantity of chromosome entering the daughter cells and a balance is maintained by the phase.

    Karyokinesis and Cytokinesis division, segregation of chromosome and cell takes place during MITOTIC PHASE.

    The notable feature of cell cycle is eukaryotic organisms though diverse and distinct have a common type of cell division over the Kingdom of Eukaryotes is a scientific wonder and research have emphasized that timing of a cell entering the cell cycle is essential in cell cycle regulation.

    History of Cell Cycle

    The history of mitosis dates back to 18th and 19th century where the aid from microscope and visibility of cell division under the microscope supported the discovery of the cell division.

    The discovery was earlier than the DNA discovery was a breakthrough in the scientific community as it answered the most intriguing question of Humans “How do we grow? Develop? Reproduce? What is the driving factor for the growth? How do we resemble our parents?” etc.,

    Before the discovery of cell division there were many theories on how the cells are related to the overall development of an organism’s lifecycle.

    One of which was Rudalph Virchow’s theory of cell: “Omnis cellula e cellula” which states that a cell originates from a pre-existing cell.

    Walther Flemming discovered and published a detailed book on cell division in 1882 after discovering cell division in 1879.

    He named it “Mitosis” after the Greek word Mito – “Wrapping thread” owing to the thread like appearances of the chromosomes.

    He conducted a detailed study and deduced staining techniques to understand cell cycle and named the stages of each division as Prophase, metaphase, Anaphase and Telophase.

    The cell division was identified in Salamander’s embryo. Flemming supported Virchow’s cell theory with precision and stated that “Omnis nucleus e nucleo” which states that a nucleus origin from a pre – existing nucleus and highlighting the chromosomal segregation and laid foundation for the theory of inheritance where the chromosomes play an important role carrying the genetic information from the parent to the offspring.

    Cell Cycle Phases

    The cell cycle is common for all eukaryotic organisms; travelling through 2 major phases based on the cell division:

    INTERPHASE and MITOTIC PHASE. Interphase consists of 3 phases Gap 1 phase, Synthesis Phase and Gap 2 Phase.

    Similarly, mitosis has four phases Prophase, metaphase, anaphase, and telophase.

    The development of cells through these phases are influenced and facilitated by heterodimeric protein kinases – Cyclin and Cyclin Dependent Kinases.

    Mitotic Phase

    The changes in above phases are minimal or not clearly visible in microscopes whereas the changes in M Phase are easily detectable.

    The phase has 4 parts in which the division takes place systematically and continuously.

    The cell stages are easily visible in plant parts as the specialized dividing region – MERISTEM is prevalent in roots and shoots are continuously dividing providing a mechanical support and functional integrity to the plants.

    The 4 phases are: Prophase, Metaphase, Anaphase and Telophase.

    Each phase has a distinctive change to be identified and Eukaryotic cells replicates in the same order in most of the organisms.

    Mitosis vs Meiosis, Mitosis vs Meiosis Chart, Mitosis Diagram, difference between mitosis and meiosis

    Prophase: The prophase is marked by chromosomal condensation and disintegration of cellular components and assembly of cytoskeletons for cell division. RNA synthesis is inhibited.

    Metaphase: Nuclear membrane is eliminated completely chromosomes are completely condensed. The cytoskeleton – spindle fibers attach to the kinetochores. The chromosomes are aligned in the equatorial plate.

    Anaphase: Chromosomal split forms daughter chromatids; travels to the opposite poles. The chromosomes are V – Shaped as they are dragged to the opposite sites.

    Telophase: Microtubules disappear and chromosomes decondense to chromatin mass. Nuclear envelope starts to form. The disintegrated organelles form again.

    Prophase Regulators

    Onset of chromosomal condensation and differentiation is marked by the prophase requires constant expression of CYCB – CDKB complex which drives the cell division and are regulated.

    The cell division is a very specific period for a developing cell which requires most of the contribution of the cell proteins and RNA to be concerned on producing two daughter cells.

    Therefore, regular cell functions does not take place in the cell and whole cytoplasm will be occupied by chromosome and spindle fibers in open mitosis or the division occupies the whole nucleus with intact nuclear membrane in closed type prevalent in Yeast and lower eukaryotes.

    Most of cell organelle are disintegrated at the beginning of the cycle and new spindle fibers are developed to aid in the chromosomal rearrangement genetic material segregation.

    CDKB – CYCB are responsible to maintain this state throughout the cycle and other CYC – CDK complexes are phosphorylated and remains inactive; especially CDKA – CYCD whose expression might initiate growth in the mitotic cell.

    Prophase Induced Cell Modification

    Prophase is predominant by cellular preparation for the division includes the chromosomal condensation and disintegration of the cell organelles mainly nuclear membrane.

    Prophase generally involves number of phosphorylation which are induced by unavailability of free genetic material to express the suppressing role.

    These are regulated and mediated by CDK – CYC complexes of the mitotic phase where the complex induces the breakdown of nuclear membrane by phosphorylating the membrane components to breakdown and further phosphorylation of other proteins of the nucleus and the cytoplasm induce disintegration of the organelles and development of new spindle fibers.

    As the cell organelles disintegrates; the mitotic spindle made of microtubules and microfilaments develops along with the chromosomal condensation by inducing the action of 2 proteins CONDENSINS and COHESIONS which coils the chromatids to chromosomes with centromeres.

    Prophase Induced Nuclear Modification
    I. Chromosomal Condensation

    Compaction of chromosome for the ease of cellular division is aided by Condensins and Cohesions an exact mechanism on how they work is not yet achieved as perceiving chromosome is well limited by the size, integrity and complexity of it.

    But theories remains that the five – subunit protein forms a ring by ATP hydrolysis and combines the chromatin and coils together.

    Cohesins are similar proteins which are present from the S Phase where it binds the Replicated DNA to the sister DNA and ensures the chromatid attachment to each other.

    Cohesins and Condensins belong to Structural Maintenance Protein – SMC maintains the chromosome structure and prevent them from tangle.

    II. Other Events

    Cell must completely prepare for the cell division to support it.

    This is done by Nucleolus disintegration: condensation of the chromosomes restricts the site for gene expression which is essential for the cell coordination and synchronization.

    When the region is coiled in the chromosome regular functions cease to exist thereby releasing inhibition from the nuclear membrane for CDK’s to phosphorylate the nuclear inner lamina which disintegrates into small protein speckles similar to that of ribosomes.

    The condensation restricts the transcription of the cell maintenance; this may lead to the disintegration of nucleolus and nuclear envelope.

    The disintegrated envelope is further displaced by Microtubules with an influx of Ca and Protein Kinase C.

    The spindle formed were present form the S phase which are also eliminated and new Microtubules are formed.

    Primary Constriction in the same chromosome results in the formation of a chromosomal element – centromere; plays an important role in connecting spindle fibers for the chromosomal segregation.

    Prophase Induced Cytoplasmic Modification

    Cell division takes place during a favorable condition where it has sufficient nutrients to promote the development of the cell cycle.

    Main changes in the cell cytoplasm are: the reduced protein synthesis by a mechanism which is to be deduced.

    Micro tubulars and Microfilaments from interphase disintegrate and new ones are formed, additionally; the region of cytokinesis is marked in the cell cortex by the thick actin bands – Preprophase Bands.

    “Tog” domain proteins initiate the microtubular formation by catalyzing the polymerization of tubulin.

    The mitotic restructure is essential to govern the cell at structural level. In mitosis; the cytoplasm remains immotile due to absence of the microtubules and microfilaments of the cell causes notable changes to support the division

    1. New microtubules are synthesized which will support the cell cycle of the daughter cells.

    2. The rigid cell becomes round and this promotes the even distribution of the cytoplasm and other structures to ensure the integrity of daughter cells.

    3. The microtubules are soluble in the cell reduces the viscosity for ease in movement as the cytoplasm as the stream gets stationary.

    All these factors ensure a proper and equal division of the cytoplasm and other organelles to the daughter cells.

    Prophase Citations

    Share

    Similar Post:

    Continue Reading
  • Interphase: Definition, Checkpoints, and Examples

    Cell Cycle and Interphase

    Cell cycle is the sequential process taking place to regulate the growth of organism; cell divides to produce a genetic replica and enters the stage of cell growth.

    Cell growth involves the synthesis of organic material and integrates information across its counter parts for synchronous development of the whole body.

    The cell synthesis phase lasts till a cell reaches its maturity; on initiation the cell again divides to produce new cell and the process continues.

    Cell cycle is a sequential development of cell between two cell divisions.

    The cycle is genetically controlled and are programmed in every cell and are specific for each region. Varied species has variable time length of cell cycle decided by physiological and influences pertaining to their niche.

    Two Phases of cell cycle are: INTERPHASE and MITOTIC PHASE.

    INTERPHASE involves G1, synthesis and G2 phase; chromosomal replication and development is regulated by the phase; determines the quality and quantity of chromosome entering the daughter cells and a balance is maintained by the phase.

    Karyokinesis and Cytokinesis division, segregation of chromosome and cell takes place during MITOTIC PHASE.

    The notable feature of cell cycle is eukaryotic organisms though diverse and distinct have a common type of cell division over the Kingdom of Eukaryotes is a scientific wonder and research have emphasized that timing of a cell entering the cell cycle is essential in cell cycle regulation.

    Interphase Types

    Interphase of the cell cycle is non dividing phase where the cells undergo major synthesis and other integrating functions transducing signals and coordinate with other cells to produce an overall reaction to the stimulus.

    Biosynthetic activity is more prevalent in this phase; absence of cell division marks a resting period; varies for every differentiated cells.

    Certain cells might have a short resting period and certain cells such as neurons loses the power of differentiation and remains constant.

    I. Gap1 Phase

    The first gap phase starts just after the 2 daughter cells formed by mitosis is long and are species specific.

    Intermediate to Mitosis and the synthesis phase the cell increases in size by synthesizing proteins and RNA for Synthesis Phase.

    In a cell cycle, G1 phase is regulated by the external and internal factors.

    External limiting factor is the availability of the nutrients in general eukaryotic organism and additional hormonal induction in plants.

    Most of the organism restrict their cycle at G1 or enter G0, few cells on proper hormonal induction will reenter the cell cycle from G0 phase; specifically, plants have a specialized region called the meristem which continuously divide to produce cell growth.

    The G1 phase determines the fate of the cell whether to enter cell cycle or to retain in G1 phase.

    The cell must grow to an appropriate size and must synthesize proteins and RNA to enter S phase, and this is regulated by Cyclins and CDK’s.

    II. Synthesis Phase

    The threshold point – restriction point in mammals and START in other organisms; when crossed the cells enter the synthesis phase.

    The G1 phase prepared the cell and its components to synthesis phase to get committed to cell division.

    The cell division is arrested when external aids are less or unavailable.

    The DNA replication doubles the genetic material, but the chromosome is not condensed and replicated material remains as chromatin.

    Synthesis of genetic material is significant in this phase where cells are committed to divide and produce 2 daughter cells in most of the metazoans.

    The S phase does not induce the increase in chromosomal numbers but doubles the genetic material.

    Endoreduplication a landmark in plant endosperm is the different process of the metazoans permits DNA replication without mitosis results in ploidy. In animals, Drosophila’s salivary glands and mammal’s hepatocytes exhibit endoreplication.

    Gap2 Phase

    Synthesis phase and Mitosis phase is separated by G2 Phase; marked by absence of synthetic function.

    This phase is a preparatory phase where the cell again enters the mitotic cycle for division.

    Decondensed chromatin starts a preliminary condensation marks the start of mitotic phase.

    Condensation inhibits the RNA synthesis gradually as the synthesis sites are being compactly wound for replication.

    G2 Phase has minimal RNA synthesis which reduces or absent in Mitotic phase.

    Interphase Checkpoints and Regulation

    The cell enters cell cycle to divide and produce daughter cells or it participates in regular metabolic function is determined during the interphase.

    The process becomes irreversible when the cells traverse across G1 phase and enters S phase.

    Determination and commitment to cell division is regulated by protein kinases CDK – CYC complex which are conserved in plants but varies across other kingdoms; are heteromeric proteins which are predominant in eukaryotic cells determines the fate of cell based on the internal and external cues. 

    Cell Cycle- Cell Cycle Phases, Cell Cycle Diagram, Cell Cycle Stage, and Cell Cycle Checkpoints 2

    Each transition from stages is regulated and governed by CYC – CDK complex; involves an intricate network of mechanism involves positive and negative regulation of many numbers of components to maintain a homeostasis.

    Stages of cell cycle also provides checkpoint to make sure the proper functioning of the cell cycle.

    G1/S Cell Cycle Checkpoints

    G1 phase is the lap phase where the cell obtains essential growth and necessary elements; increase in size by biomolecular synthesis; to proceed the cell cycle or to enter G0 to restrict them by functioning regular metabolic activities.

    In most of the eukaryotes the increase in CDKA – CYCD in G1 phase makes the cell cross the restriction point and irreversibly committed to cell cycle; involves an activation pathway.

    The Cyclin D concentration responds to external cues such as hormone induction, availabilities of nutrients; promote CDKA-CYCD complex thereby initiating the G1 activity; the concentration of the CYCD-CDKA complex increase the phosphorylation of Rb (Retinoblastoma) proteins.

    The Rb proteins are the inhibitor of transcription factors transcribing the proteins and RNA essential for the synthesis phase.

    In the absence of the CYC-CDK complex the pathway is inhibited by Rb protein.

    The transcription is also inhibited when a cell synthesis the essential quantity of proteins required for S Phase or when the CYC-CDK complex over express in the process.

    The transition pathway is conserved in plants. Generally; plants have a single Rb homologue and 6 types of E2F transcription factors.

    E2F is further divided into 2 groups: CANONICAL and ATYPICAL. E2Fa, E2Fb, E2Fc require a dimeric substance such as DP to bind to the DNA are canonical and monomeric factors E2Fd, E2Fe, E2Ff are Atypical.

    Each E2F factors has a definitive function which are not yet determined correctly; but from many scientific experiments in Arabidopsis the functions are deduced as:

    E2Fa – Transcriptional

    E2Fb – Transcriptional

    E2Fc – Down Regulation of Transcription (Repressors)

    E2Fd – unidentified

    E2Fe – Prevent endocycles delaying cell elongation

    E2Ff – Cell expansion Also, E2Fa and E2Fb are more essential in S Phase to balance proliferation and endoreduplication in cell.

    E2F transcription leads to initiation and increase in the DNA replication by setting up a replication origin where ORC – origin replication complex binds to produce the replicating fork for DNA synthesis.

    The regulating checkpoint in the process is the expression of E2Fc transcriptional factors which are induced by the genetic expression mediated by E2Fa/b; inhibit the over expression of DNA Replication.

    G2/M Cell Cycle Checkpoints

    The transition of the particular phase involves many genes and transcriptional factors in cycle progression.

    The transcriptional factors are of 5 types: MYB3R1, MYB3R2, MYB3R3, MYB3R4 and MYB3R5.

    The G2/M transition involves proteins which are also present in M phase induces cytokinesis.

    The functions of transcriptional Factors are:

    MYB3R2 – circadian clock

    MYB3R1, MYB3R4 – activates the gene expression

    MYB3R3, MYB3R5 – repress the gene expression

    MYB3R3 and 5 regulates the function of gene expression of G2/M phase when it over express.

    Along with this; APC/C – Anaphase promoting complex/Cyclosomes targets the proteolysis which regulates the G2/M transition and supports Mitosis phase of cell proliferation.

    Interphase Citations

    Share

    Similar Post:

    Continue Reading
  • Cell Cycle: Definition, Description, Stages, and Checkpoints

    Cell Cycle Introduction

    Beings of earth are programmed to be born, grow, reproduce, and die. Multicellular eukaryotes develop from a unit cell to an array of trillion celled creature by a simple mechanism of cell division.

    The capacity to divide is the measure of growth of an organism and the capacity to grow differs for every species are limited by internal and external factors.

    Proliferation of cell can be infinite which might have resulted in an overwhelming cornucopia of cells.

    The cell proliferation and growth are finite and regulated by an organism by spatial and temporal means according to its functional ability.

    The increase in cell corresponds to the growth an organism exhibits; regulated or stopped after a particular period.

    Plants tends to show a regulated unlimited growth; developing over lifetime a distinctive character of plants to support the sedentary life; but the growth is governed by internal and external cues of development.

    Specialized regions such as meristem plays a primary role in plant cell division and growth.

    Growth is regulated at cellular level by the cell cycle and growth regulators plays a significant role in inducing growth and supporting the structural composition of growth.

    Periodic stages of cell cycle involve the major function of a single cell over a lifetime following a repetitive phase of development and function.

    What is Cell Cycle

    Cell cycle is the sequential process taking place to regulate the growth of organism; cell divides to produce a genetic replica and enters the stage of cell growth.

    Cell growth involves the synthesis of organic material and integrates information across its counter parts for synchronous development of the whole body.

    The cell synthesis phase lasts till a cell reaches its maturity; on initiation the cell again divides to produce new cell and the process continues.

    Cell cycle is a sequential development of cell between two cell divisions.

    The cycle is genetically controlled and are programmed in every cell and are specific for each region.

    Varied species has variable time length of cell cycle decided by physiological and influences pertaining to their niche.

    Cell Cycle History

    Discovery of microscope was a breakthrough in understanding the physiology at cellular level.

    Robert Hooke was first to observe cork cells; from there microscopic observation revealed the world of microbiota.

    The cell was discovered and components, functions and the significance were found. In late 19th century; it was deducted that new cell develops from the pre – existing cell by the process of cell division.

    Cell division led to elucidation of cell cycle processes which was determined to be the principal process regulating growth and development of the cell and the organism.

    But the DNA replication restricted to S phase of the cell cycle was not discovered until 1950 by Alma Howard and Stephane Pele.

    The conservative nature of the cell cycle was identified in 1980’s; were scientists found out that the molecular processes of cell cycle is similar in all eukaryotic organisms; from experimenting various research on organisms.

    Cell cycle regulators and genes “START” was discovered by Leland Hartwell.

    Paul Nurse discovered CDK which runs the cell cycle based on the genetic expression.

    Timothy Hunt discovered cyclin activating subunit of CDK’s. Leland Hartwell, Paul Nurse and Timothy Hunt shared Nobel Prize for Medicine in 2001.

    Characteristic of Cell Cycle

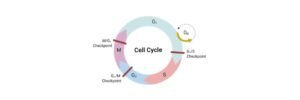
    o The sequential progress of cell growth and cell division to form new daughter cells are termed as cell cycle.

    o The sequences are divided into 4 divergent phases falls in 2 majors they are: Interphase and Mitotic Phase.

    o The stages of cell cycle is common for eukaryotic organisms.

    o The cell cycle through evolution is conservative because of the similarities of the phases in all organisms.

    o The cycle is well regulated by genes and protein kinases.

    o Protein kinase action is same in all eukaryotic species signifies the conserved evolution and a proof that all organisms arise from a common ancestor who diverse from single celled unicellular organism to complex human beings.

    o The stages of cycle are governed by time at which cells enter the cell cycle.

    o Cell cycle is asynchronous in a living organism.

    o The cell division is regulated and controlled by the protein kinases to maintain the structural integrity and functionality of the organism.

    o As the organism grows few regions remains constant with no cell growth or maintained to a threshold level where cell death is balanced by cell division.

    o In few parts the cells the growth might be rapid or enter the cycle first and other cells may enter later result in asynchronous cell division.

    o Length of cell cycle varies from species to species. Few organisms have rapid replication system compared to other organism.

    o For Example: Yeast completes its cell cycle in 90 minutes (about 1 and a half hours) whereas in human cell cycle lasts for 24 hours and in Drosophila it is about 8 minutes.

    o Phase of cell cycle is sequential in continuously dividing cells were one phase follows the other in a constant order becomes inevitable for a proper functioning of the cell cycle are regulated by the controls of the cycle.

    o In multicellular organisms, higher level of cell differentiation reduces the capacity of a cell to proceed the cycle.

    o A post – mitotic differentiated cell restricts it at G1 phase or enter G0 phase a quiescent phase. 

    o Stem cells are an ideal example for cell cycle where it keeps on proliferating to maintain the integrity of the organism replacing the dead cells by new ones.

    o Most of the cells completes the cycle whereas few other remains in the synthetic phase their lifetime without entering the dividing phase.

    o Proceeding the phases of cell cycle is determined by the synthesis phase where a cell cycle sets up an upper threshold level which must be crossed to enter the division phase.

    Cell Cycle Phases
    Cell Cycle, Cell Cycle Definition, Cell Cycle Description, Cell Cycle Stages, Cell Cycle Checkpoints 1

    The cell cycle is common for all eukaryotic organisms; travelling through 2 major phases based on the cell division: Interphase and Mitotic Phase.

    Interphase consists of 3 phases Gap 1 phase, Synthesis Phase and Gap 2 Phase.

    Similarly, mitosis has four phases Prophase, metaphase, anaphase, and telophase.

    The development of cells through these phases are influenced and facilitated by heterodimeric protein kinases – Cyclin and Cyclin Dependent Kinases.

    I. Interphase

    Interphase of the cell cycle is non dividing phase where the cells undergo major synthesis and other integrating functions transducing signals and coordinate with other cells to produce an overall reaction to the stimulus.

    Biosynthetic activity is more prevalent in this phase; absence of cell division marks a resting period; varies for every differentiated cells.

    Certain cells might have a short resting period and certain cells such as neurons loses the power of differentiation and remains constant.

    II. Gap1 Phase

    The first gap phase starts just after the 2 daughter cells formed by mitosis is long and are species specific.

    Intermediate to Mitosis and the synthesis phase the cell increases in size by synthesizing proteins and RNA for Synthesis Phase.

    In a cell cycle, G1 phase is regulated by the external and internal factors.

    External limiting factor is the availability of the nutrients in general eukaryotic organism and additional hormonal induction in plants.

    Most of the organism restrict their cycle at G1 or enter G0, few cells on proper hormonal induction will reenter the cell cycle from G0 phase; specifically, plants have a specialized region called the meristem which continuously divide to produce cell growth.

    The G1 phase determines the fate of the cell whether to enter cell cycle or to retain in G1 phase.

    The cell must grow to an appropriate size and must synthesize proteins and RNA to enter S phase, and this is regulated by Cyclins and CDK’s.

    III. Synthesis Phase

    The threshold point – restriction point in mammals and START in other organisms; when crossed the cells enter the synthesis phase.

    The G1 phase prepared the cell and its components to synthesis phase to get committed to cell division.

    The cell division is arrested when external aids are less or unavailable.

    The DNA replication doubles the genetic material, but the chromosome is not condensed and replicated material remains as chromatin.

    Synthesis of genetic material is significant in this phase where cells are committed to divide and produce 2 daughter cells in most of the metazoans.

    The S phase does not induce the increase in chromosomal numbers but doubles the genetic material.

    Endoreduplication a landmark in plant endosperm is the different process of the metazoans permits DNA replication without mitosis results in ploidy.

    In animals, Drosophila’s salivary glands and mammal’s hepatocytes exhibit endoreplication.

    IV. Gap2 Phase

    Synthesis phase and Mitosis phase is separated by G2 Phase; marked by absence of synthetic function.

    This phase is a preparatory phase where the cell again enters the mitotic cycle for division.

    Decondensed chromatin starts a preliminary condensation marks the start of mitotic phase.

    Condensation inhibits the RNA synthesis gradually as the synthesis sites are being compactly wound for replication.

    G2 Phase has minimal RNA synthesis which reduces or absent in Mitotic phase.

    V. Mitotic Phase

    The changes in above phases are minimal or not clearly visible in microscopes whereas the changes in M Phase are easily detectable.

    The phase has 4 parts in which the division takes place systematically and continuously.

    The cell stages are easily visible in plant parts as the specialized dividing region – MERISTEM is prevalent in roots and shoots are continuously dividing providing a mechanical support and functional integrity to the plants.

    The 4 phases are: Prophase, Metaphase, Anaphase and Telophase.

    Each phase has a distinctive change to be identified and Eukaryotic cells replicates in the same order in most of the organisms.

    Prophase: The prophase is marked by chromosomal condensation and disintegration of cellular components and assembly of cytoskeletons for cell division. RNA synthesis is inhibited.

    Metaphase: Nuclear membrane is eliminated completely chromosomes are completely condensed. The cytoskeleton – spindle fibers attach to the kinetochores. The chromosomes are aligned in the equatorial plate.

    Anaphase: Chromosomal split forms daughter chromatids; travels to the opposite poles. The chromosomes are V – Shaped as they are dragged to the opposite sites.

    Telophase: Microtubules disappear and chromosomes decondense to chromatin mass. Nuclear envelope starts to form. The disintegrated organelles form again.

    Mitosis vs Meiosis, Mitosis vs Meiosis Chart, Mitosis Diagram, difference between mitosis and meiosis

    These phases mark the Karyokinesis were the nucleus and other cell parts are newly formed.

    Cytokinesis is the formation of daughter cells after mitosis; indicated by furrow which starts to differentiate two daughter cells grows gradually forming a cell plate while the organelles formed gets segregated. Cell plate represents the lamella between 2 cell walls.

    Cell Cycle Regulation

    The cell cycle is regulated by heterodimeric protein which was first discovered in sea urchin; the cyclic appearance named the compound CYCLIN; is the regulatory subunit activating Cyclin dependent Kinases – Catalytic subunit.

    The involvement of CDK’s promotes an intricate network of mechanism triggering positive and negative response creates a loop controlling the cell cycle.

    The protein kinases phosphorylate other repressors of the cell cycle traversing cell over distinct phases of development.

    The cell cycle and the basic protein kinases were conserved throughout the eukaryotic cells, but the CDK types of serine – threonine special class are not conserved; varying from quantity to Plant types

    The Animals has a distinctive CDK types; CDK1 – CDK7 are present in animals and CDK A – CDK E in plants.

    Cell Cycle- Cell Cycle Phases, Cell Cycle Diagram, Cell Cycle Stage, and Cell Cycle Checkpoints 1

    Cyclins also falls under 5 types A, B, C, D, and H. The cyclin is transcript from most conserved part of the human genome preserving its integrity over their period.

    CDK and Cyclin combines to regulate the cell cycle at each phase; characterized by specific combination of Cyclin and CDK promoting the cell to reproduce for the growth of an organism.

    Distinct phases have different cyclin – CDK complex varying in animals and plants.

    Monomeric CDK does not participate in regulation of cell cycle; CDK require cyclin subunit to be activated by CDK activating kinases.

    These heteromeric protein can be inhibited by inhibiting proteins – Kip-related proteins by inhibitory phosphorylation.

    The CDK’s and cyclins are dependent on the rate of turnover, transcription, and translational control.

    Cell cycle Regulation in Plants

    The CDK – CYC (cyclin) complex regulates the cell cycle. Each phase expresses specific complex for the cells to be accustomed to proceeding through cell cycle. CDK – A;1 is expressed in all phases but are activated by D type cyclins in G1 Phase to traverse the restriction point.

    Transcription of CDK A – CYC D accumulates and facilitates the preparation of cell to transverse G1/S phase to commit to cell cycle.

    The synthesis of CDKA – CYCD complex when increase in quantity reaches a restriction point and when it exceeds the point the cell commits to cell division.

    When the point is not crossed the cell remains in G1 phase and eventually enters G0 phase indicating maturation and takes part in regular cellular activities.

    In S phase CDKA – CYCA is expressed during the synthesis of DNA duplicate.

    Traversing from S phase the CYCD starts expressing with the entry of G2 phase along with CYCA2 – CDKA later this followed by the expression of CDKB – CYCB which on reaching a threshold limit indicates the cells are ready for the cell division.

    Again, at the end of G2 phase the positive feedback of CDKB-CYCB induces the CDKA-CYC3 to be produced all along the mitosis and prevails in G1 PHASE to increase the growth of the cell.

    Cell Cycle Plant Hormones

    Plant growth hormones Auxins, cytokinin and brassinosteroids has a significant role in control of the cell cycle.

    Auxin and Cytokinin are essential for cell proliferation and are widely expressed in the meristematic tissues of plants promotes plant growth by cell division induces the cell cycle.

    These were discovered from the mutational studies inhibiting the hormones and observing cell cycle.

    Cytokinin helps in G1/S transition and G2/M transition by dephosphorylating CDK’s thereby activating the cell cycle or inhibits WEE 1 kinase by down regulation.

    Abscisic acid inhibits cell cycles by promoting inhibitors such as KRP1 in certain plants.

    Similarly, Jasmonic Acid inhibits DNA replication when administered during G1 phase and has minimal inhibition effects in later stages.

    Ethylene promotes cell death in the developing cell cycle.

    Cell Cycle Citations

    Share

    Similar Post:

    Continue Reading
  • Bacitracin Susceptibility Test: Principle, Procedure, and Results

    Bacitracin Susceptibility Test Introduction

    Many types of biochemical and antimicrobial tests are being performed in a laboratory in order to detect the specific characteristic of a micro-organism especially a pathogen and its reactions to the certain enzymes.

    One such biochemical test is Bacitracin susceptibility test. Bacitracin susceptibility test is one of the antimicrobial tests which are used for identifying a group A streptococcus from the other Beta-hemolytic species of Streptococci.

    What is Bacitracin Susceptibility Test?

    Bacitracin susceptibility test is considered as an antimicrobial disk tests used foe identifying the Group A Streptococci from the other species of Beta-hemolytic Streptococci.

    Antimicrobial susceptibility tests are usually performed in order to differentiate a particular species from another specific genus.

    Here, antimicrobial tests are used in order to determine the susceptibility of a bacterial species to a specific antibiotic.

    Bacitracin

    Bacitracin is one of the bactericidal drugs which is used to treat the superficial skin infections. But these are rarely injected for systemic uses.

    Bacitracin is obtained from the Bacillus subtilis which is one of the polypeptide antibiotics.

    Bacitracin often interferes with the peptidoglycan and help in producing the bacteria and also in inhibiting their growth.

    Bacitracin blocks the bactoprenol from transporting the sugars such as NAM and NAG sugars across the cell membranes, which further inhibits the production of peptidoglycan.

    The growth of Group A Beta-hemolytic Streptococcus is inhibited by the Bacitracin. Where as the other species of beta-hemolytic streptococci are not inhibiting.

    This helps us to differentiate the two different group of organisms. However, Bacitracin disks are mainly used against the Streptococcus pyrogens which helps in inhibiting the growth of an organism.

    Bacitracin results in forming the zone of inhibition of about 12mm against the S. pyrogens, hence it helps us to determine the positive control of the organism while testing.

    Bacitracin Susceptibility Test Objective

     The main aim of the Bacitracin susceptibility test is to differentiate the Group A Beta-hemolytic Streptococci form the other species of Beta-hemolytic Streptococci.

     To detect the pattern of antibiotic susceptibility in various organisms against Bacitracin.

    Bacitracin Susceptibility Test Principle

    Generally, the growth of Group A Beta-hemolytic streptococci on the blood agar is inhibited by using 0.04 units of Bacitracin disks.

    Whereas the other similar species like Micrococci and Streptococci are also inhibited but this 0.04-unit disc, whereas the other Coagulate-negative Staphylococci are resistant to this.

    Bacitracin susceptibility test discs are simply a filter paper disc, which are impregnated with 0.04 units of Bacitracin.

    These impregnated discs are then placed on an agar, which allows the antimicrobial to diffuse along with the medium thus inhibiting the growth of the organisms.

    This test result is evaluated after incubating based on the zone of inhibition that are formed around the discs.

    If the growth is seen at the edges of the disk, the it is deemed as resistant, in other case if the zone is present in a circular zone around the stick, then it represents the inhibition and susceptibility of the organisms.

    Usually, Bacitracin disks are time saving experiments along with minimum labor and materials, if they are used in the form of screening test before serological grouping.

    It is also said that Group A Streptococci are more sensitive to Bacitracin than the Beta-Hemolytic strains of the other groups.

    Hence it is advisable to perform Bacitracin susceptibility test through antimicrobial disks for a rapid diagnosis, especially for Group A Streptococci.

    Micro Organisms Tested

     This test is generally used for Penicillin-susceptible test or for stick colonies of the Gram-positive cocci, which are found in groups and catalyzes the positive and negative coagulates.

     Here lemon-Yellow colored colonies are not detected as they are assumed as Micrococcus.

    Bacitracin Susceptibility Test Reagents

    Media Used:

     Blood agar or

     Muller Hinton Agar

    Supplies Used:

     Bacitracin 0.04-unit discs

     Sterile forceps

     Swab

     Inoculation broth.

    Bacitracin Susceptibility Test Procedure

    Usually, two different kinds of methods are used for Bacitracin Susceptibility test based on the kind of culture media they are used.

    The test can be performed either by using pure culture of an organism or directly via clinical samples. The methods of Bacitracin susceptibility tests are listed below.

    1. Hebert’s Method Using Blood Agar Plates

    Initially 0.1 McFarland suspension of the organism is performed using a over night culture of the organism.

    Different sections of blood agar plate are inoculated which results in forming a lawn culture.

    Here each section is inoculated in one specific direction and the area of inoculation should be at a separation of 10mm between each of the discs that were placed.

    These are then left to dry for about 10 minutes and after drying they are placed on the agar using sterile forceps.

    Then the disc is tapped using the sterile stick and adherence is ensured.

    The plates are then incubated at a temperature of about 35 to 37ºC for about 24 hours.

    After a period of incubation, the zone of incubation is observed thus results are measured.

    Further the results are confirmed using serological testing.

    2. Muller-Hinton Agar Method

    This method is also used to observe the susceptibility of the fast-growing organisms. Here 0.5 Mc Far land suspension of the organisms is prepared using an over night culture of the organism.

    The MHA plates disks are inoculated using a suspension with sterile swabs to form a bacterial lawn on the agar.

    Then the medium is allowed to dry. After drying the antibiotic disks are placed on the agar placed using the sterile forceps and the discs are placed by maintaining a distance of about 10mm.

    Then further the discs are tapped using sterile sticks.

    Then the inverted plates are incubated at a temperature of about 35 to 37ºC for about 24 hours.

    After incubation the zone of inhibition is observed and measured.

    Bacitracin Susceptibility Test Results
    Zone of InhibitionMediaResult
    Zone of inhibition is 6mm or less than thatBlood agar or Muller Hinton AgarResistant
    Zone of inhibition is greater than 10mmBlood agar or Muller Hinton AgarSusceptible
    Zone of inhibition is between 6mm to 10mmBlood agar or Muller Hinton AgarIt indicates probable susceptibility so the tests should be repeated
    Bacitracin Susceptibility Test Citations

    Share

    Similar Post:

    Continue Reading
  • Acetate Utilization Test: Principle, Procedure, and Results

    Acetate Utilization Test Introduction

    In the modern world, apart from life style changes, we come across many medical terms as a part of our daily activities, such as Lab test, diagnosis, vaccine, chemicals and so on, which became most common terms as a part of other things we hear.

    Many tests are performed in a laboratory and in biochemical labs to detect the nature of the pathogen or a disease. Acetate utilization test is one such test which is used to determine whether the organism has the ability to use acetate as a sole source of carbon.

    What is Acetate Utilization Test?

    The acetate utilization test is generally used to test the ability of the organism to utilize the acetate as the single source of carbon.

    This test is also performed as a qualitative test for the differentiation of the Gram-negative bacteria into fermentative and the oxidative group of bacteria.

    This test is also being used to differentiate the species of Shigella from E. coli and the non-fermentative negative bacteria.

    Acetate agar which contains sodium acetate as the sole source of nitrogen is used for inoculating the organism. Growth is indicated for the positive test of acetate utilization test.

    When the bacteria metabolize acetate, the ammonium salts are broken down into ammonia, which increases the pH medium of the culture, this increase in pH turns the bromothymol blue indicator in the medium changes from green to blue.

    Acetate Utilization Test Principle

    In acetate utilization test, Acetate agar is employed as a test organism. This acetate agar has the ability to utilize acetate.

    The culture medium is composed of Sodium acetate which acts as a sole carbon source and the inorganic ammonium salts as the source of the nitrogen. Where the growth of organisms suggests the positive results for the utilization of acetate.

    During the metabolism process of acetate, by the bacteria, the ammonium salts are broken into ammonium, that elevates alkalinity.

    The shift in the pH changes bromothymol blue indicator in the medium from green to blue. This medium is generally used for differentiating the Shigella spp from Escherichia coli.

    As Shigella spp doesn’t have the capability to metabolize the acetate, However, approximately of about 94% of Escherichia coli plays a major role in utilizing the acetate.

    Acetate Utilization Test Reagents

    Media: The culture media is composed of Sodium acetate agar.

    Ingredients Gram/liter
    Sodium Chloride5.0
    Magnesium sulfate0.1
    Ammonium phosphate-monobasic1.0
    Potassium phosphate-dibasic1.0
    Sodium acetate2.0
    Agar20.0
    Bromothymol blue0.08

     Sterilized sticks and inoculating loops

     Sterile pipette

     Incubator

     Sterile saline.

    Acetate Utilization Test Procedure

    Procedure for Acetate utilization test involves two steps;

    1. Preparation of media

    2. Utilization test

    1. Preparation of Media

    For the preparation of media, 69.1 grams of the dehydrated powder is added in beaker along with 1000 milliliters of the deionized or the distilled water.

    Instead of dehydrated powder lab-prepared media can also be used.

    The prepared suspension is then heated till boiling; so that the medium is dissolved completely.

    Then the dissolved medium is dispensed into tubes and they are sterilized in an autoclave at 121ºC for about 15 minutes.

    After completing the process of autoclaving the tubes are taken out and cooled at a slanted position to a temperature of about 40 to 45º.

    The position is then maintained in order to obtain butts of depth 1.5 to 2.0 cm.

    2. Utilization Test

    The isolated colony is taken from an 18 to 24-hour culture with the help of a sterile inoculating needle.

    A turbid suspension of saline is prepared by using 18-to-24-hour culture from a noninhibitor plate of culture.

    The acetamide agar tube is inoculating by streaking the surface of a slant with the light inoculum which is picked from the culture.

    The slant is then streaked back and froth with the loop or using an inoculating stick.

    The cap or the test tubes are loosened to ensure whether the inoculum is getting sufficient aeration.

    The tubes are then incubated aerobically at the temperature of about 35 to 37ºC for about seven days.

    As incubation at 35 to 37ºC is not sufficient for thee Enterobacteriaceae, incubation at 30ºC is followed for seven days for the non-fermentation of Gram-negative rods.

    The test tubes are examined regularly for at least 7 days before discarding the samples.

    Acetate Utilization Test Result

    For a positive result, the growth is represented as a change of color green to intense blue along the slant. Where as for negative result, the growth is absent and there will be no color change and the slant remain green as same.

    Bacterial Control

    Mostly two different organisms are taken for the positive and negative controls as the form of quality control for the acetate utilization test.

    ControlIncubationResults
    Shigella flexneriAerobic incubation is followed for 24 to 48 hours at temperature of about 33 to 37ºCAcetate negative, where there is no growth and no change in color and the medium remains green
    Escherichia coliAerobic incubation is followed for 24 to 48 hours at temperature of about 33 to 37ºCAcetate positive where the growth is shown and change of color to intense blue from green
    Acetate Utilization Test Uses

    • This test is usually used to test the ability of the organism to utilize acetate as the source of carbon.

    • This test is also used in the form of qualitative test for differentiation of Gram-negative bacteria for fermentation and oxidative group of bacteria.

    • Acetate agar can also be used as a selective media for the isolation of Escherichia coli.

    Acetate Utilization Test Citations

    Share

    Similar Post:

    Continue Reading
  • Threshold Frequency: Definition, Equation, and Examples

    Threshold Frequency Definition

    The threshold frequency is defined as the minimum frequency of the incident radiation below which photoelectric emission or emission of electrons is not possible.

    The threshold frequency refers to the frequency of light that will cause an electron to dislodge emit from the surface of the metal.

    If γ signifies the frequency of incident photon and γth signifies threshold frequency, then;

    • If γ < γTh, then this denotes that no ejection of photoelectron will occur.

    • If γ = γTh, then this denotes that photoelectrons are just ejected from the surface of the metal, however, the kinetic energy of the electron is equal to zero.

    • If γ > γTh, then this denotes that the photoelectrons are ejected from the metal surface. Photoelectrons ejected have some kinetic energy.

    These trends are thus termed as the photoelectric effect.

    Kinetic energy (K.E) is equal to half times the mass (or abbreviated as m) multiplied by the square of the velocity (or abbreviated as v) of the electrons as shown below;

    K.E = 1/2 (mv2)

    Photoelectric Effect

    The photoelectric effect is referred to a phenomenon in which electrons are expelled or ejected from the surface of a metal when light is incident on it. Electrons thus emitted are also termed as photoelectrons.

    Therefore, the threshold frequency is referred to as the frequency of the light which carries sufficient energy to extricate an electron from an atom.

    According to Albert Einstein, the photoelectric effect is described as follows:

    Thus,

    hν = W + E

    Where

    • h signifies Planck’s constant.

    • ν signifies the frequency of the incident photon.

    • W signifies a work function.

    • E signifies the maximum kinetic energy of ejected electrons: 1/2 mv².

    The Work Function

    The work function of a metal is referred to as the minimum amount of energy which is required to start the emission of electrons from the surface of the metal. The work function is expressed in electron volts. One electron volt is referred to as the energy required to move an electron across a potential difference of one volt. Different metals have characteristic work functions, and also distinctive threshold frequencies.

    For instance, aluminum has a work function equal to 4.08 eV, however, potassium has a work function equal to 2.3 eV.

    1eV = 1.6 x 10⁻¹⁹ Joule

    Photons

    A photon can be defined as a quantum of light that has zero rest mass and moves at the speed of light in the vacuum. The phenomena of the photoelectric effect cannot be defined by considering light as a wave. Though, this effect can be described by considering the particle nature of light, which further states that light can be imagined as a stream of particles of electromagnetic energy. Hence, these particles of light are termed as photons.

    The energy held by a photon is as follows;

    E = h𝜈 = hc/λ

    Where,

    • E signifies the energy of the photon

    • h signifies Planck’s constant

    • 𝜈 signifies the frequency of the light

    • c signifies the speed of light (in a vacuum)

    λ signifies the wavelength of the light

    Work Function and Threshold Frequency Formula

    The theory of the photoelectric effect was proposed by Einstein by using Max Planck’s theory of light energy. It was thus considered that each packet of light energy (or commonly called as photons) carried energy equal to hv where h represents a proportionality constant known as the Planck constant and v represents the frequency of the electromagnetic waves of light.

    Kmax represents the maximum amount of kinetic energy carried by the atoms before leaving their atomic bonding.

    To describe the threshold frequency the equation for the photoelectric effect can be written as follows:

    Kmax = hv-W

    Where,

    W represents the work function of the metal. It is defined as the minimum energy that needs to be supplied to the metal body for the discharge of photoelectrons.

    Now W can be written as follows:

    W = hvo

    Here

    vo represents the photoelectric threshold frequency of the electromagnetic radiation.

    Threshold Frequency Applications

    The concepts of threshold energy in photoelectric effect and threshold frequency find their application in several devices and processes. Some of which are as follows;

    • Photoelectron Spectroscopy: Photoelectron spectroscopy measurements are often done in a high vacuum environment to avert the electrons from being dispersed by gas molecules that are present in the air. In this process, we use monochromatic X-rays or UV rays of known frequency and kinetic energy (K.E) to determine experimentally the composition of given area samples.

    • Night Vision Devices: When Photons strike alkali metal or semiconductor material (such as gallium arsenide) in an image intensifier tube, then this causes the expulsion of photoelectrons because of the phenomena known as the photoelectric effect. This is further accelerated by an electrostatic field where electrons strike a phosphor-coated screen hence converting electrons back into photons. Signals are thus produced and intensified due to the acceleration of electrons. This concept which is mentioned here is used in night vision devices.

    • Image Sensors: Television in the early days contained video camera tubes that made use of the photoelectric effect to convert an electronic signal into an optical image. Though, presently, the mechanism of television working has been reformed.

    The concept of photoelectric emission, work function, and photoelectric threshold frequency are essential to understand quantum physical sciences. This is also required for constructing various devices and to study various other phenomena.

    Threshold Frequency Examples

    Q. Calculate the threshold frequency for a metal with a work function of 5 electron volt or eV?

    Solution: The equation for work function is given as-

    W = hvo

    vo = W/h

    Where h represents Planck’s constant

    vo represents the threshold frequency of metal

    Converting 5eV into Joules as we know

    1eV = 1.6 x 10⁻¹⁹ Joule

    So, 5 eV = 5 x 1.6 x 10-19 Joule

    vo = (5 x 1.6 x 10-19) / (6.63 x 10⁻³⁴)

    Thus,

    vo = 1.20 x 10¹⁵ Hertz or Hz

    Threshold Frequency Citations

    Share

    Similar Post:

    Continue Reading
  • Examples of Physical Properties: Definition, Meaning

    Examples of Physical Properties

    Changes can be categorized into physical and chemical. The matter is made up of tiny particles and has both the properties which are;

    Examples of Physical Properties 1

    A chemical property is defined as the characteristic of a substance that can be observed in a chemical reaction.

    For example heat of combustion, toxicity, acidity, reactivity etc.

    A Physical Property is defined as the characteristic of a substance that can be observed without changing the chemical nature of the substance such as its size, state of matter, colour, mass, density etc. Some other physical properties include solubility, melting and boiling points etc.

    Classification for Physical Properties

    There are two classes of physical properties which are;

    1. Extensive Property

    2. Intensive Property

    1. Extensive Property

    Extensive properties are those properties that depend on the size of the sample.

    Shape, volume and mass are extensive properties. The properties like length, mass weight and volume that not only depend on the size but also depend on the quantity of the matter.

    For instance, if we have two boxes made up of the same material one has the capacity of 6 litres and the other has the capacity of 12 litres then the box with 12-litre capacity will have more amount of matter as compared to that of the 6-litre box.

    2. Intensive Property

    Intensive properties are those properties that do not depend on the size or amount of matter in the sample.

    Temperature, pressure and density are some of the examples of intensive properties other examples include colour, melting and boiling points as they will not change with the change in size as well as quantity of matter.

    The density of 1 litre of water or 1000 litre of water will remain the same as it is an intensive property.

    Physical Change

    Physical change takes place without any changes in the molecular composition of the substance. The same molecule is present in the substance throughout the changes.

    Physical changes are related to the physical properties of a substance which are solid liquid and gas.

    During physical change the composition and the chemical nature of matter are not changed chemical property is not affected by the physical change of a substance.

    The physical change includes a change in colour, solubility, change in the state of matter etc.

    Examples of physical change include melting an ice cube, dissolving sugar and water. Boiling water is also an example of physical change because the water vapour has the same molecular formula as that of liquid water.

    Use of Physical Properties

    Physical property is used to determine the appearance, texture, colour etc. of a substance thus, these physical properties are important as they help us to differentiate between different compounds, unlike chemical properties which help us to differentiate between various compounds only when a new substance is formed from a given substance by chemical reactions.

    Examples of Physical Properties

    A few examples of the physical property of matter comprise of;

    • Malleability occurs when metal is moulded into thin sheets, for instance, silver is shiny metal and it can be moulded into thin sheets.

    • Hardness which is another physical property helps to determine how the element can be used. For Example; Carbon in diamonds is very hard whereas carbon in graphite is very soft.

    • Melting and boiling point is the physical property that is unique identifiers, especially of compounds

    • Melting Point: When the solid matter is heated it ultimately melts or changes into its liquid state. The ice is a solid form of water that melts at 0 oC or 32 oF and changes to its liquid state that is water or H2O.

    • Boiling Point: When the liquid matter is heated further it ultimately boils or vaporizes into its gaseous state. Liquid water boils and changes into gaseous molecules or water vapour at a temperature of 100 oC.

    • Density implies the weight of the substance

    Density is defined as mass divide by volume.

    Density = Mass/Volume

    • Colour is another physical reflective property of the given material. For example; Rusting of iron.

    • Volume is referred to as a three-dimensional space that is occupied by a matter.

    • Mass is one of the most significant fundamental property of an object and is defined as the measure of the amount of matter that is present in a body or substance.

    • Weight is defined as the measure of the force of gravity acting on an object.

    Examples of Physical Properties Citations

    Share

    Similar Post:

    Continue Reading
  • Metric System Chart: Definition, Formula, and Calculation

    Metric System Chart

    The metric system chart was introduced in the year 1790 in France and was the historical invention of the international system of units or SI units which is also known as metrification.

    The various units of measurement lead to the introduction of the metric system.

    Metric System

    The metric system of measurement is the standard way of measuring distance, height, and many other day to day events.

    Each object is measured according to its length, volume weight height, and time.

    The three main basic units of the metric system are;

    Metre: a unit used to calculate the length of an object.

    Kilograms: a unit that is used to measure the mass of an object

    Second: a unit of time.

    Origin of the Metric System

    Metrication is defined as a process that implements the international system of units called SI units. The Metric system is followed by nearly all countries except United States, Myanmar, and Liberia.

    The United States further introduced its system of units or system of metric units which are now called the United States customary units.

    Difference Between USCS and SI Units

    The United States metric units are also called “imperial units.” The key difference between the SI units and the American metric units is the terms and the form of units used.

    For instance, In the SI unit, the length is measured using the meter whereas In USCS foot is used for measurement.

    Metric Conversion

    Metric conversion has referred to the conversion of the given units to the chosen units for any given quantity that is to be measured. This metric system of measurement is a set of standard units that are defined to measure the length, weight, and capacity of the given object.

    Metric Conversion Chart

    Metric conversion charts help us in the conversion of given units to desired units. The metric conversion helps in easier and quick calculations.

    Some metric chart tables are given below;

    Length Conversion Chart

    This unit length is used for measuring the size of an object or the distance that an object travels from one end to another end.

    There are different units of length which are meters, kilometers, feet, etc. The basic tool which is used to measure length is called a ruler.

    For Example; The height of this whiteboard is about 3 meters.

    The smallest unit of measuring length is a millimeter and the largest unit of measuring length is kilometers.

    Length conversion chart

    1 inch = 2.54 cm

    1 foot = 12 inch

    1 yard= 3 feet or 36 inches

    1 mile = 1760 yards

    1 kilometer = 1000 metre

    Weight Conversion Chart

    Weight is the unit that is used to measure the mass of a substance. The standard unit that is used for the measurement of mass is the kilogram, gram ton, etc.

    The basic tool which is used to measure the weight of an object is the weighing scale.

    For instance; the weight of this alcohol bottle is 250 grams.

    Weight conversion chart

    1 kilogram =1000 gram

    1 pound = 16 Oz

    1 Oz = 16 drums

    1 ton = 2,000 LB

    Volume Conversion Chart

    Volume is the unit that is used to measure the space occupied by an object or matter. The standard unit used for the measurement of capacity is litre. Other units used for measurement of unit volume are milliliter etc.

    For example; 500 liters of juice.

    Volume conversion chart

    1 litre = 1000 ml

    1 cup=250 ml

    1 gallon = 4 watts

    1 pint = 2 cups

    Time Conversion Chart

    The standard unit for the measurement of time is in seconds. Other metric units of time are minutes, hours, etc.

    1 minute = 60 seconds

    1 hour= 60 minutes

    1 day = 24 hours

    1 week = 7 days

    Area Conversion Chart

    The area is occupied by a two-dimensional figure the area is usually measured in square units.

    1 acre= 43560 square feet

    Metric System Chart Citations

    Share

    Similar Post:

    Continue Reading
  • Volume: Definition, Formula, Chart, and Calculation

    Volume Definition

    Volume is referred to as a three-dimensional space that is occupied by a matter for any other closed figure.

    SI unit of volume is cubic meter (cm3) but many other units exist which include cubic centimeter, pint, quart, gallon, tablespoon, etc.

    Examples of volume are; These beer bottle bottles hold 250 ml of alcohol.

    Ishita drank 100 ml of water.

    You can purchase a gallon of milk.

    Volume of Liquid

    The volume of a liquid can be measured with the help of a measuring container such as a measuring cup, graduated cylinders.

    The volume of liquids is addictive but this is not always true because the volume of miscible liquids such as that of alcohol and water may be less than the sum of the separate volumes.

    Another point to be noted is that dissolvable solids in two liquids don’t always result in their adjective volumes.

    Volume of Gas

    Volume of a gas is defined as the volume of its container as the gas expands to fill the space available to them in the given container.

    The volume of a gas is sometimes determined by the displacement of its liquid.

    Volume of Solid

    The volume of a solid can be calculated by using its dimensions.

    For example; the volume of a rectangular solid is the product of its length, width, and height that is V=lwh.

    Volume vs Mass

    The volume and mass are considered the same but these are two different properties of matter.

    Volume is defined as the amount of space occupied by a substance on the other hand mass is the amount of matter contained in a substance.

    Density is defined as mass per unit volume but it is possible to have volume without the mass the example for the same would be an enclosed vacuum.

    Volume vs Capacity

    Capacity and the volume of a container are not the same as capacity is defined as the capability of an object to contain a substance that is either solid, liquid, or gas, whereas volume is referred to the three-dimensional space that is occupied by the matter.

    Volume is measured in cubic units such as in cubic centimeters and cubic meters etc.

    Capacity is measured in metric units such as in liters, gallons, etc.

    Charles Law

    Charles law states that the volume of a certain amount of gas is directly proportional to that of temperature in kelvin when the pressure remains constant.

    This can be written as;

    V = kT

    k = proportionality constant

    V = volume of given gas

    T = temperature of a given gas

    Boyles Law

    Boyle’s law states that the volume of a certain amount of gas is inversely proportional to its pressure when the temperature is kept constant.

    The equation can be represented in the form of;

    P = k/V

    k = a proportionality constant

    P = Pressure of given gas

    V= volume of a given gas

    Avogadro's Law

    Avogadro’s law states that the volume is directly proportional to the number of moles of a given gas when the pressure and the temperature both remain constant.

    The following equation can be written in the form of

    V = kn

    k = proportionality constant

    n = Number. of moles of a given gas

    V= volume of a given gas

    Ideal Gas Law

    The above four laws discussed are combined to produce an ideal gas law which is a relationship between pressure, volume, temperature, and the number of moles present in given gas.

    The equation is given as

    PV = nrt

    P = pressure of the gas

    V= volume of gas

    N = number of moles of gas

    T = temperature in kelvin

    r = Constant and is also known as the ideal gas constant for the universal gas constant.

    Citations

    Share

    Similar Post:

    Continue Reading
  • International System of Units (SI Units): Chart,...

    International System of Units (SI Units)

    International system of units (SI Units) is the most widely accepted system of measurement and this system is built on 7 primary units which are:

    Length

    Time

    Weight

    Amount of substance

    Electric current

    Temperature

    Luminous intensity

    This international system of units was earlier referred as meter-kilogram-second (MKS) system.

    The principle behind international system of units is that it used to provide the same values across the world for measurements such as length, height, weight etc.

    SI plays a vital role in international conferences and is also used in scientific and technological research.

    History of SI Units

    The international system of units was introduced in 1960 which was adopted by 11th general conference on weights and measure or CGPM.

    This system was invented to modify the definition of units and to be used as technology for measuring objects that we use in our daily lives.

    The United States further introduced its own system of units or system of metric units which is now called as United States customary units or USCS

    Difference Between USCS and SI Units

    The United States metric units are also called as “imperial units.” The key difference between the SI units and the American metric units is the terms and the form of units used.

    For instance, In SI unit, the length is measured using the metre whereas In USCS foot is used for measurement.

    The international system of units consisted of following three categories mentioned below; Base units Supplementary units Derived units

    The seven base units are given below:

    Length

    This unit length is used for measuring the size of an object or the distance that an object travels from one end to the other end. There are different units of length which are metre, kilometers, feet etc. The most common tool which is used to measure length is called a ruler.

    For Example; The height of this blackboard is about 3 metres. Smallest unit of measuring length is millimeter and the largest unit is kilometers.

    1 kilometer = 1000 metre

    Time

    The standard unit for measurement of time is seconds. Other metric units of time are minutes, hours etc.

    1 minute = 60 seconds

    1 hour= 60 minutes

    1 day = 24 hours

    1 week = 7 days

    Weight

    Weight is the unit that is used to measure the mass of an object. The standard unit that is used for the measurement of mass is kilogram, gram ton etc.

    The most common tool which is used to measure the weight of an object is the weighing scale. For instance; the weight of this bottle is 250 grams.

    1 kilogram =1000 gram

    Amount of Substance: Mole

    The amount of matter of a system that comprises as many elementary entities as there are atoms in 0.012 kilogram of carbon 12. Elementary entities are subatomic units that comprise matter and energy.

    The symbol of unit mole is mol.

    Luminous Intensity

    The luminous intensity, in given route, of a source produces monochromatic radiation of frequency 540×1012 hertz and has a radiant intensity in that path of 1/683 watt per steradian.

    The unit of luminosity is candela which is denoted by cd.

    Current

    Electric current is well-defined as the rate of flow of negative charges of a conductor. Since the charge is calculated in coulombs and time is in seconds, the unit of electric current is coulomb/Sec (C/s) or amperes. The SI unit of current Ampere is denoted by unit symbol A.

    Thermodynamic Temperature

    The kelvin (abbreviation K), is the SI unit of temperature. One Kelvin is 1/273.16 (3.6609 x 10 -3) of the thermodynamic temperature of the triple point of a pure water that is H 2O.

    Supplementary Units
    Plane Angle

    The name of the unit which is used to calculate the plane angle is radian. Symbol of radian is rad.

    Radian describes the plane angle that is subtended by an arc of a circle.

    Solid Angle

    The name of the unit which is use to describe the solid angle is steradian Symbol of steradian is sr.

    A steradian describes the solid angle at the centre of sphere that is subtended on a section of surface.

    Derived Units

    Few examples of derived units are given below;

    Area: Unit name of area is square metre.

    Frequency: Unit name is hertz (Hz)

    Volume: Unit name is cubic metre

    Speed: Unit name is metre per second

    Magnetic: Field strength Unit name is ampere pe metre

    International System of Units (SI Units) Citations

    Share

    Similar Post:

    Continue Reading